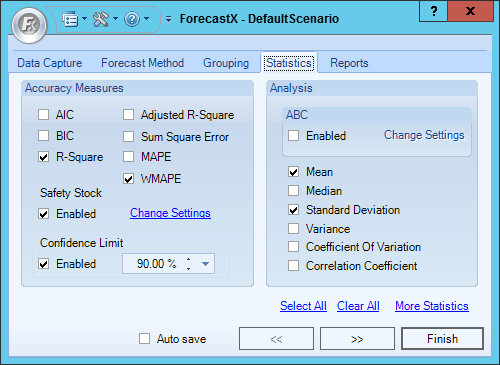
This section details the statistics that can be found under in the Accuracy measures area of the Statistics tab, as well as the Accuracy tab after clicking More Statistics.
AIC
Akaike Information Criterion (AIC) is a statistic that aids in the Box-Jenkins specification stage of model building. A model that minimizes the AIC is considered to be the most appropriate model. This implies that when several models may be appropriate, choose the one with the smallest number of free parameters, thus the smallest AIC.
BIC
Bayesian Information Criterion (BIC) is an order estimation criterion used in the Box-Jenkins specification stage of model building. A model that minimizes the BIC is considered to be the most appropriate model. When several models may be appropriate, choose the one with the smallest BIC. The AIC and BIC differ in their second terms, which are penalty functions for extra parameters.
Often, AIC and BIC will lead to the same model choice.
R-Square
R-Squared is referred to as the coefficient of determination. It tells the amount of variance in Y that can be explained by variable X. In other words, variance is how dispersed the data is, calculated by how far away the data points are from the average data point. Where Y is the dependent variable and X is the independent variable, R-Squared determines the level of influence X has on Y's variance.
2-1 Means Absolute % Error
The MAPE is commonly used in quantitative forecasting methods because it produces a measure of relative overall fit. The absolute values of all the percentage errors are summed up and the average is computed. In comparison to Mean Error (ME), which is determined simply as the average error value and affected by outliers (large positive and negative errors can cancel each other out resulting in a zero error), or Mean Absolute Error (MAE), which de-emphasizes outliers by their average, the MAPE is a more meaningful measurement.
For example, if you are forecasting sales that vary greatly from month to month and the MAPE is +5%, it is a more useful result than a mean error. The MAPE also de-emphasizes outliers but produces results calculated as the average absolute error in percentage terms, which are easily interpretable.
Adjusted R-Square
The coefficient of determination establishes that when an explanatory variable is added to a model, R-Squared decreases, no matter how useless the additional variable. So, R-Squared is the fraction of variance explained by the model.
Ideally, the measure of fit would decrease when useless variables are entered into the model as explanatory variables. In other words, if the measure of fit decreases every time a useless variable is entered into the model, then the analysts can measure and determine which variables to keep and which to expunge. A statistic widely used to achieve this is the coefficient of determination adjusted for the number of parameters in the model (Adjusted R-Squared). Adjusted R-Squared tells you when the negative effect of the variable outweighs the positive.
Sum Squared Error
Sum Squared Error (SSE) is an accuracy measure where the errors are squared, then added. It is used to determine the accuracy of the forecasting model when the data points are similar in magnitude. The lower the SSE, the more accurate the forecast. Understanding this accuracy statistic will help you choose which forecasting model best fits your data.
Safety Stock
Safety Stock is designed to allow you cushion when planning for demand. If there is demand in your forecast, you can set a specific number of periods of demand to have. Unlike other statistics, safety stock is only reported in the forecast table of the Executive Report.
- From the Statistics tab, click Change Settings in the Safety Stock area.
The Safety Stock Settings window displays.
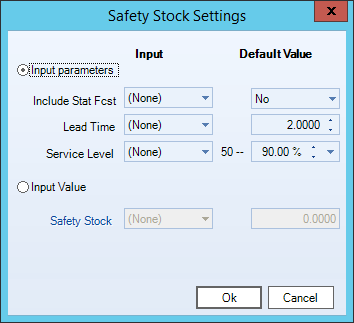
- Select either Input parameters or Input Value. Slowing Moving Output will be automatically selected when the Slow Moving Demand Forecast method is used. The table below details the options available.
Input Parameters
Description
Include Stat Fcst Indicate whether to include the Statistic Forecast in the calculation of the Safety Stock. When set to Yes, this will make will make your Safety Stock a Stocking Level. Lead Time Specify the lead time of the Safety Stock. Lead Time is the periods that the safety stock covers. Service Level Specify the service level that the Safety Stock meets. Safety Stock Select this option to calculate the Safety Stock. This field is used when you need to set your Safety Stock to a default value for all your series or use a DRP parameter.
- Click OK when finished.
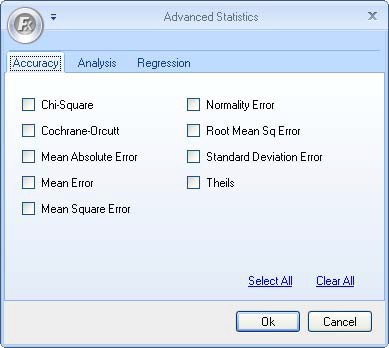
Chi-Square
Chi-Square is a commonly used goodness-of-fit test to compare actual data with fitted data according to the null hypothesis. The null hypothesis states that there is no significant difference between the fitted value and actual data. This statistic returns the p-value of the test instead of the value of Chi-Square test. The range of p-value is from 0 to 1. The closer to 1, the better fit.
Cochran-Orcutt
When there is a strong indication of the presence of autocorrelated errors in a forecasted model (especially a regression model), it is not suitable to proceed with ordinary least squares method. But the alternative estimation to the new data set Yt - r* Y(t-1) will have a better result for appropriated r. Cochrance-Orcutt is the method to estimate r.
Means Absolute Error
The Mean Absolute Error is similar to the Mean Error, except the MAE considers the absolute values of the errors. In other words, it will take negative values and replace them with their absolute (positive) values. This method de-emphasizes large outliers, because (negative and positive results are not able to cancel each other out). A zero MAE represents a perfect fit.
Mean Error
The Mean Error (ME) value is calculated as the average error value. It is less reliable in some cases than other accuracy statistics because there is the risk that large outliers can cancel each other out, producing an ME near zero, which would indicate a perfect fit. For example, positive and negative error values could produce an average of zero, which may not be an accurate description of the overall fit of the forecast.
Mean Square Error
Mean Square Error (MSE) is one of the traditional measures of forecast accuracy. Mean Square Error is used when all the errors are similar in magnitude. If the data contains one or two large errors, calculate the Mean Absolute Error (MAE), since using sum squares magnifies these errors.
Also, use the MAE or MSE to select the right forecasting model by choosing the model that results in the smallest MAE or MSE. Keep in mind that you cannot compare forecast models that used different data transformations and you cannot compare MSE to MAE.
Normality Error
A standard assumption of forecasting models is that the error terms are normally distributed. The Normality Error is the error associated with the single time series normal distribution.
Root Mean Square Error
The Root Mean Square Error is the square root of the Mean Square Error. It is calculated by taking the square root of the arithmetic mean of squared deviations from the mean. It is also called standard deviation when the deviations do not represent errors.
Standard Deviation Error
The standard deviation error is used in regression analysis to measure the average variation of the observed values around the forecast values. It answers the question, "How far away are the forecasted values from the actual values in the data set?"
Theil's Statistic
Theil's Statistic is an accuracy measure that compares the accuracy of a forecast model to the actual model. Theil's uses the actual value of the last time period as the forecast. The closer Theil's Statistic is to zero, the more accurate the forecasting model. For instance, if Theil's Statistic is equal to 1, the forecast is completely inaccurate. If it is equal to zero, then the forecasting model is a perfect fit.
T-Test
The T-test determines whether or not the parameter or series contributes to the accuracy of the model. If the T-test statistic is greater than 1.96, the parameter or series does contribute to the accuracy of the model.
This test is performed automatically for certain reports and forecast methods. The T-Test is only included in an audit report and only when the chosen forecast method is one of the following:
- Trend (Linear) Regression
- Multiple Regression
- Stepwise
- Polynomial Regression
- Box Jenkins
Comments
0 comments
Please sign in to leave a comment.