This section details the statistics that can be found under the Regression tab after clicking More Statistics.

ANOVA Table
Analysis of variance (ANOVA) is used to uncover the main and interaction effects of independent variables on a dependent variable.
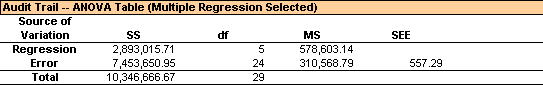
There are two rows in the output of an ANOVA table. One is for regression, which represents the part of the dependent variable that is interpreted by the regression model. The other is for error, which represents the part not interpreted by the regression model.
- SS is the sum squared of deviation.
- df is the degree of freedom.
- MS is the mean of SS.
- SEE is the square root of MS.
The bigger ratio of the MS of the regression and error, the better of the model. In the above graph, the ratio is 4145489/59359, which is around 70. This dependent variable is well explained by the independent variables in the regression model.
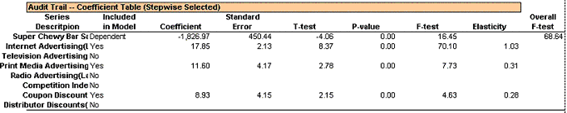
Coefficient Table
This table summarizes the significance of each independent variable and the overall significance of the regression model.
The table below details what each column means:
The F-test of the whole regression model. The bigger value, the better model.
| Column | Description |
|
Series Description |
The description of the dependent and independent variable. If the regression uses lag options, this column also indicates the lagged degree of the variables. |
|
Included in Model |
Indicates whether a variable is included in the regression model or not. It also indicates which variable is the independent variable. |
| Coefficient | The coefficient of each independent variable included in the model. For the dependent variable, it is the value of constant term. |
| Standard Error |
The standard error of the corresponding variable. |
| T-Test | The t-test of the corresponding variable. Generally, if the absolute value of a t-test is greater than two means the corresponding variable is significantly important in this regression model. |
| P-Value | Small p-values means the corresponding variable is significant. |
| F-Test | Generally, if the value of F-test is more than four, then the variable is significant. |
| Elasticity | Indicates the percentage change of dependent variable when the corresponding variable changes in one percent. It is one way to tell whether one independent variable has a large effect on the dependent variable or not. |
| Overall F-Test | The F-test of the whole regression model. The bigger the value, the better model. |
Pairwise Coefficient of Determination
The coefficient of determination, or R-Squared, tells the proportion of variance in Y that can be explained by X. X is an independent variable that has some influence on Y's variance. It can also explain how dispersed the data points are from the mean data point. This can be useful in determining if an independent variable affects the seasonality of your data.
Covariance
The degree of dependence between two random variables is measured by covariance. This is useful if you have two random, dependent variables, X and Y.
Comments
0 comments
Please sign in to leave a comment.