The Adaptive Exponential Smoothing method is a derivative of Simple Exponential Smoothing. The Level value is systematically changed from period to period to allow for pattern changes in the Historical data. Adaptive Exponential Smoothing is automated, which makes it a useful method to employ when large numbers of items are involved. The data is non-seasonal and shows no trend.
Adaptive Exponential Smoothing is beneficial to use for a product that has been sold for a long period of time, only to encounter a dramatic market change in recent periods.
To use the Adaptive Exponential Smoothing forecasting method:
- Click
 and open the xls file.
Note: The ForecastingExamples.xls file is a data example to demonstrate how the Adaptive Exponential Smoothing method is used. For your company’s purposes, you will have your own data available. - Click the Adaptive Exp. Smoothing tab at the bottom of the Excel sheet to select the example spreadsheet.
- Click in a cell containing data and open ForecastX™ by clicking
 .
.
ForecastX appears. - Click the Forecast Method tab.
- In the Forecast Technique area, scroll through the list of methods and select Adaptive Exponential Smoothing. The Adaptive Exponential Smoothing Forecasting technique appears.
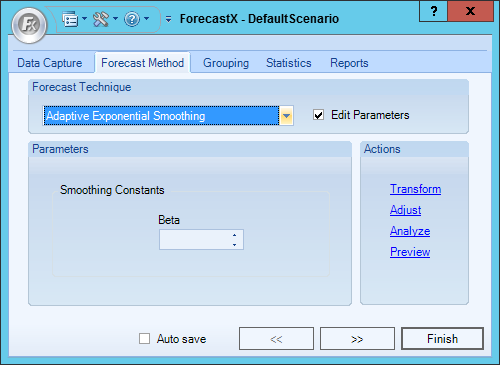
- Enable the Edit Parameters checkbox to activate Adaptive Exponential Smoothing’s parameters.
- In the Smoothing Constants area, enter a number for Beta.
- In the Reports tab, select the Standard report option to output the results in an Excel Spreadsheet.
- In the Chart area of the Reports tab, select Standard and Chart in Worksheet.
- Click Finish.
There are two areas in the Standard report to view the results. First, the Excel spreadsheet produced by ForecastX shows three things:
- Actual values of your original Historical data
- Forecast method chosen
- Forecasted values for both the original Historical data and the future values. (The forecasted values are in bold)
Second, near the bottom of the spreadsheet is a small table that contains basic error measurements: Weight Mean Absolute Percentage Error, R-Square Error, Mean, and Standard Deviation.
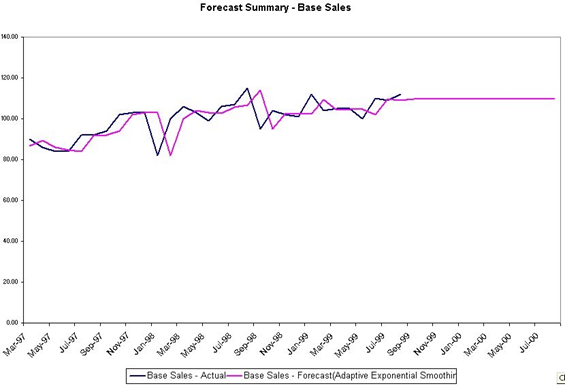
Click the Chart1 tab in the lower-left corner of the spreadsheet.
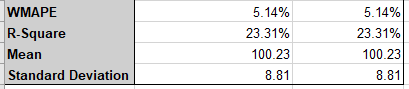
The table shows you that your forecast accuracy is very good, and that the fit of the forecast, represented by the R-Square value, is very good.
The graph enables you to view how the forecast is represented in the future and how your data has been behaving in the past. As the graph indicates, the market changes from April 2005 to June 2007 did affect the sales of your product. Since the Adaptive Exponential Smoothing method was chosen, ForecastX weighted the most recent values more heavily than older values. This enables you to consider how the market is currently behaving, and how that behavior is going to affect your total sales.
Comments
0 comments
Please sign in to leave a comment.