Holt's Double Exponential Smoothing method is similar to Simple Exponential Smoothing. It calculates the level component to measure the level in the Forecast. It also adds the trend component to create a Linear trend in the Forecast. This equation is similar to a Linear Regression line and is useful when a product is experiencing an exponential growth or decline, while not experiencing Seasonality. If your data is dynamic and is not affected by seasonal factors, then Double Holt is an optimal method to use.
To use the Double Holt forecasting technique:
- Click on
 and open the ForecastingExamples.xls file.
Note: The ForecastXExamples.xls file is a data example to demonstrate how the Croston’s Intermittent method is used. For your company’s purposes, you will have your own data available. - Open the Double Holt’s spreadsheet.
- Click in a cell containing data and open ForecastX by clicking on
 .
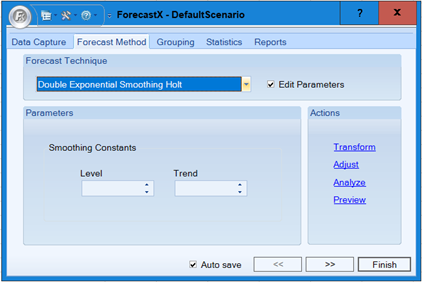
. - Click the Forecast Method tab.
- In the Forecast Technique area, scroll through the list of methods and select Double Exponential Smoothing Holt. The Double Exponential Smoothing Holt Forecasting technique displays.
- On the Data Capture tab, click Data Cleansing. The Data Cleansing window displays.
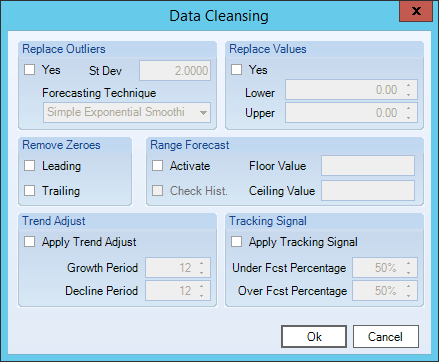
- In the Replace Outliers area, select Yes to have ForecastX automatically remove the outliers and produce a more accurate Forecast.
- In the Reports tab, enable the Audit checkbox.
- Click Finish.
After ForecastX produces the results in an Audit Trail report, the statistics are displayed to measure the values of your Double Holt forecast. The graph that is made of the actual, fitted, and forecast values enables you to see the trend in your new product.
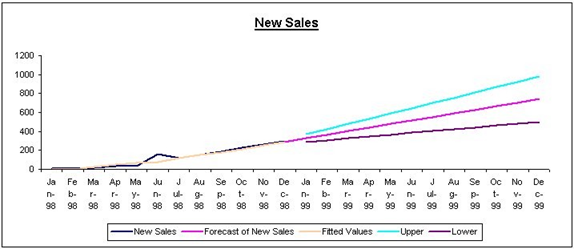
Notice June 1998 on the graph. ForecastX removed a large data point, the outlier. The only thing you needed to do was click Replace Outliers on the Advance Option screen.
There are two important statistics to look at in the Audit Trail report for the Double Holt forecast:
- Constant Smoothing values
- Level and Trend measurements
These values tell you how significantly ForecastX smoothed the data. The gamma value is high (near 1.00), so the smoothing was insignificant. However, the Level value is low and therefore a significant Smoothing Constant. This means that your data has significant trend.
Comments
0 comments
Please sign in to leave a comment.