Erlang B is used to work out how many lines are required if the traffic figure (in Erlangs) during the busiest hour known. The Erlang B distribution is based on the following assumptions:
- Holding times are constant and exponential
- Blocked cells are cleared
- Calls are taken in random order
- There are an infinite number of sources
To use the Erlang B forecasting method:
- Click
 and open the ForecastX_Erlang.xls file.
Note: The ForecastX_Erlang.xls file is a data example to demonstrate how the Erlang B method is used. For your company’s purposes, you will have your own data available. - Click the Erlang B1 sheet.
- Click in a cell containing data and open ForecastX by clicking
 . ForecastX appears with the Data Capture tab open.
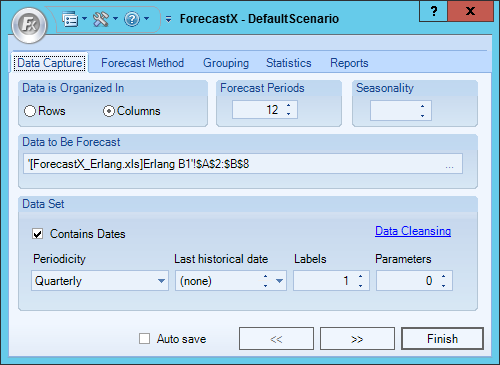
- In the Forecast Periods field, enter 4 to forecast for the next four quarters.
- Click the Forecast Method tab.
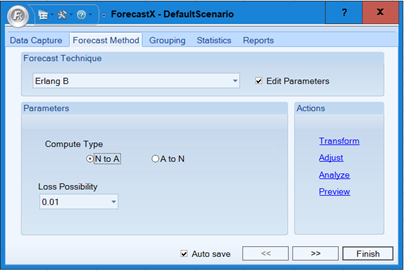
- From the Forecast Technique menu, scroll through the list of methods and select Erlang B. The Erlang B Forecasting technique appears.
- Enable the Edit Parameters checkbox to activate Erlang B’s parameters.
- In the Compute Type area, select either N to A, or A to N. N means the number of servers, and A means traffic measured by Erlang B.
- In the Lost Possibility area, select one of the options for the percentage of loss that is possible.
- Click Finish.
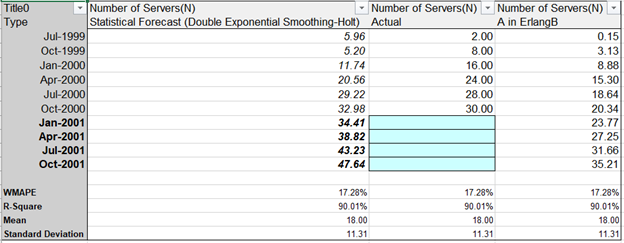
As you review the results within the standard report, notice how ForecastX has forecasted the number of servers needed for the next 4 quarters, and ForecastX has also given the traffic levels (A).
Comments
0 comments
Please sign in to leave a comment.