Simple Exponential Smoothing uses both historical data and fitted data to generate a new forecast. Simple Exponential Smoothing gives higher importance to recent values than older observations. For example, in a three-period Moving Average forecast, February, March and April actual values will evenly determine May's forecast.
Depending on the level given to the data series, a Simple Exponential Smoothing Method creates a forecast for May that relies more so on April's observations. Simple Exponential Smoothing is most effective as a forecasting method when irregular influences comprise the main effects on the Historical time series values.
The level of smoothing is always a value between zero and one. If the level value is closer to 1, then the forecasted value is going to more closely reflect the last actual value. If the value is closer to 0, then the forecasted value is going to more closely reflect the first actual value.
To use the Simple Exponential Smoothing forecasting method:
- Click
 and open the ForecastingExamples.xls file.
Note: The ForecastingExamples.xls file is a data example to demonstrate how the Simple Exponential Smoothing method is used. For your company’s purposes, you will have your own data available. - Click the Simple Exp. Smoothing tab at the bottom of the Excel sheet to select the example spreadsheet.
- Click in a cell containing data and open ForecastX™ by clicking
 . ForecastX appears.
 - Click the Forecast Method tab.
- From the Forecast Technique menu, scroll through the list of methods and select Simple Exponential Smoothing. The Simple Exponential Smoothing Forecasting technique appears.
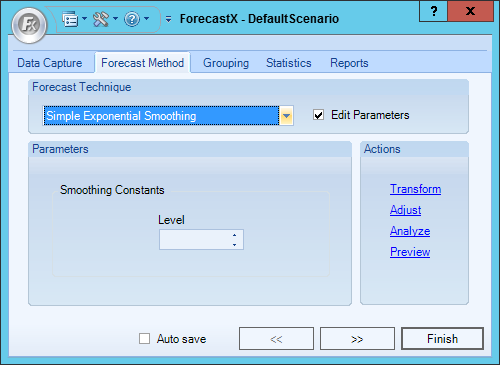
- Enable the Edit Parameters checkbox to activate Simple Exponential Smoothing’s parameters.
- In the Smoothing Constants section, enter the Level.
- On the Reports tab, enable the Audit checkbox.
Note: The Audit Trail report provides a graph of your forecast and analyzes the statistics used to measure the Simple Exponential Smoothing forecast. - Click Finish.
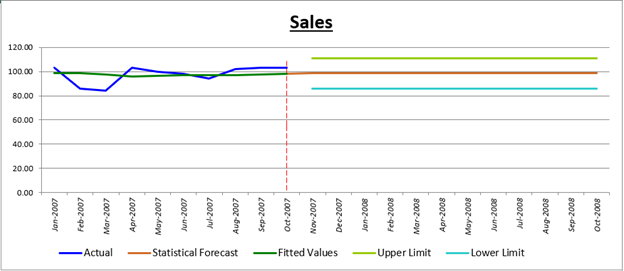
ForecastX provides two tools to judge the accuracy of your forecast and the direction your business is heading. The first thing you see is the Executive Report chart.
One line represents the fitted values and the forecasted values of the actual values. The other line shows the actual values.
ForecastX also produces a detailed table that shows the optimized parameters for your Exponential Smoothing forecast.
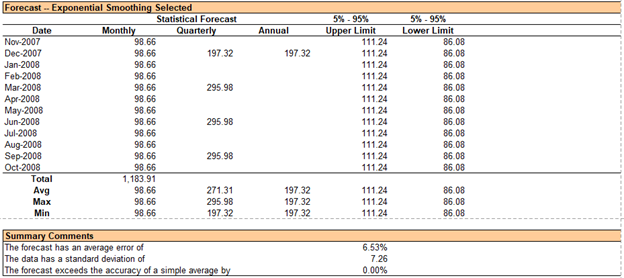
You can see on the table that this forecast has an average error of 6.53%. This means that ForecastX smoothed your data to a considerable degree. A lower smoothing value represents a high level of smoothing.
Comments
0 comments
Please sign in to leave a comment.