The One-Step Forecast with Procast
Session 1: One-Step Forecasting with Procast
- Open the ForecastXTrainingSet.xls spreadsheet that accompanies ForecastX. You can find this either in your Start menu under JGS – ForecastX, or in Excel on the Add-Ins tab in the Samples folder. Use the sheet named Procast.
- When the spreadsheet opens, select a cell that contains data. Click the ForecastX icon within the Microsoft Excel toolbar under Add-ins to start the tool.
The Intelligent Data Recognizer looks at the data and determines the following:
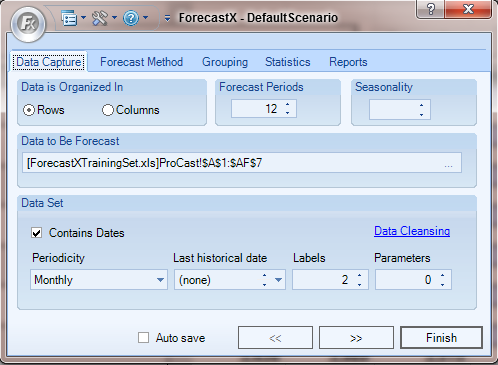
- Organization: Automatically detects whether your data is in rows or columns.
- Forecast Range: The number of periods to forecast. By default, this is set to 12.
- Data to be Forecast: Selects the range of data to use to produce the forecast.
- Dates: Determines whether your data contains dates and what length of time each cell represents.
- Labels: Determines how many descriptive labels your data contains.
You are now ready to create your first forecast!
- Simply click Finish to complete your forecast.
- When the forecast is complete, click View Output.
ForecastX automatically produces a Standard Report that appears on a separate worksheet. The worksheet lists what forecasting method ForecastX chose for each of the data series. The fitted values are listed in italics below the actual values for each series. You can also see the graph included above the table - use the > and < buttons just below the graph to navigate between different series, select a specific one from the menu, or select a series in the table and click Current Series.
ForecastX has listed the forecast values in bold. To the right of the forecasted values, ForecastX has produced four accuracy statistics that can help you determine how trustworthy the forecast is.
| WMAPE | R-Square | Mean | Standard Deviation |
| 4.52% | 73.29% | 5,313 | 597 |
| 9.43% | 47.72% | 3,477 | 616 |
| 14.28% | 58.90% | 3,700 | 1,389 |
| 20.74% | 0.00% | 3,293 | 837 |
| 80.00% | 0.00% | 20 | 42 |
| 14.58% | 49.92% | 2,227 | 616 |
- Mean Absolute Percentage Error (MAPE) tells you the average error between the forecast model and your historical pattern – lower values are better.
- R-Square tells you how much better this forecast is than a simple average – higher values are better.
- Mean gives you the average values of each line of history.
- Standard Deviation helps you understand how variable your data is –1 standard deviation from the mean should cover 68% of all values, and 2 standard deviations from the mean should cover 95% of all values.
You have just produced an accurate, one-step forecast with Procast.
Comments
0 comments
Please sign in to leave a comment.