The Data Capture tab is used to provide ForecastX™ with information on where and how your data is configured among other information.
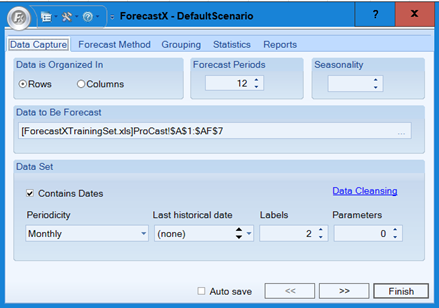
The table below details what each feature means:
| Feature | Description |
| Data Is Organized In | Specify whether your data is in columns or rows. Your data needs to be arranged in a consecutive line either by rows or columns. To change the selection, select the appropriate radio button. |
| Forecast Periods |
Specify how many periods you want to forecast. The default is 12 periods. ForecastX provides the ability to forecast up to 9999 periods. You can enter the number of periods you want to forecast or use the up and down arrows |
| Seasonality |
Enter the seasonality of your data or allow ForecastX to automatically detect any seasonality. For example, if data contains quarterly seasonality, you could enter 4 in this text box, or leave it blank to see if ForecastX detects the quarterly pattern. You can enter the seasonality or use the up and down arrows. |
|
Data to Be Forecast |
Specify the data range to include in the forecast. As ForecastX opens, the Intelligent Data Recognizer (IDR) selects the data range automatically. The IDR will attempt to interpret the layout of your data. It will guess whether the data is organized in columns or rows, the data range to include in your forecast, whether the data includes dates, and how many descriptive labels exist. To manually specify the data range: 1. Click inside the text box. The Data Selection box appears. 2. Click inside the Data Selection text box. Select a data range in the spreadsheet by clicking and dragging, or using Excel short cut keys, such as shift, control, or down arrow. Note: Your data range should not include Event Indices used in Event Modeling or Day Indices used in Census X-11. Note: The data to be forecasted can also have multiple range selections, both columns and rows. For example, if you only wanted to forecast some of the items in your dataset you would first select the row with the headers and then while pressing [Crtl], you could click and select the rows for the items you wanted to forecast. |
| Data Set |
Specify whether your data contains dates and any descriptive labels. If you have Excel formatted dates, the IDR will identify them, and then select the correct time frame. To manually specify that your data includes dates:
|
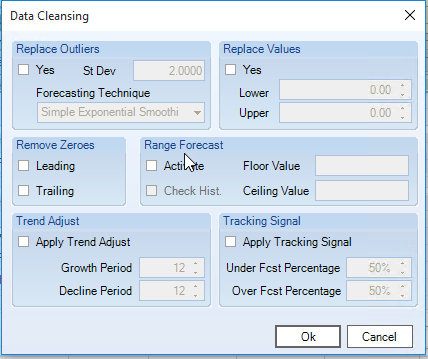
Data Cleansing
The Data Cleansing window contains methods to clean data and optimize the accuracy of your forecast. To open the Data Cleansing window:
- From the Data Capture tab, click Data Cleansing. The Data Cleansing window appears.
- The following table details what each feature means.
| Feature | Description |
| Replace Outliers |
Select Yes if you would like to replace Outliers in your data. An Outlier is an exception (i.e., an anomaly in your data) that distorts the accuracy of your forecast. For example, a snowstorm in Texas in the middle of July that affects your snow shovel sales is an Outlier. St Dev — The distance between a data point and its corresponding fitted value is used to determine whether or not a data point is an Outlier. The distance is measured by the number of standard deviations and the default is 2. Therefore, if the distance is larger than two standard deviations, then the data point is an Outlier. Forecasting Technique — Select the forecasting technique you would like to use to perform outlier replacement. ForecastX provides the ability to choose from seasonal, non-seasonal, and growth techniques. |
| Replace Values |
Indicate whether or not you would like to replace missing or erroneous values in your data. Lower — Indicate the low end of the range of values you want replaced. Upper — Indicate the high end of the range of values you want replaced. Occasionally, data is incomplete; a period or a range of periods is not reported. Instead of leaving it blank, ForecastX replaces it with a value calculated by Exponential Smoothing. |
| Remove Zeroes |
Indicate the zeros that you want removed from your data. Leading — Enable this checkbox to remove leading zeros. Trailing — Enable this checkbox to remove trailing zeros. Frequently during Batch Forecasting, not all items have data for all time periods. ForecastX provides the ability to ignore the blank or zero values that occur before or after the data series. This is beneficial in a situation where a new product is being introduced and there are several periods of zeros where the product is non-existent. |
| Trend Adjust |
Trend Adjust increases accuracy by adjusting the trend of the forecasted values. For some data, the trend in forecasted values is very steep (in both increasing and decreasing directions). The Trend Adjust option can reduce the steepness of the trend to an acceptable level. To control the adjusted steepness, a control point is introduced. At the control point, the trend reduces to the 1% of its original value. Apply Trend Adjust — Enable this checkbox if you would like to use Trend Adjust. Growth Period — Specify the period of the control point if the trend in the forecasted value is increasing. Decline Period — Specify the period of the control point if the trend in the forecasted value is decreasing. |
| Tracking Signal |
Select this option if would like to apply a tracking signal to your forecast. The tracking signal is used for fine-tuning the overall accuracy of your Forecast. The tracking signal determines whether or not your fitted values are under or over forecasting. The fitted values are the baseline of your forecast. When comparing it with the overall MAPE, it improves the accuracy by less than a percentage point. Apply Tracking Signal — Enable this checkbox if you would like to use Tracking Signal. Under Fcst Percentage — Specify the under forecast percentage you want to track. Over Fcst Percentage — Specify the over forecast percentage you want to track. |
| Range Forecast |
Enable the Activate checkbox if you would like to set the allowed minimum and maximum forecast values. Check Hist — Validate the floor and ceiling values gains the history. The lowest and highest history values are compared to the floor and ceiling values. If any history values are higher than the ceiling value, the ceiling values are ignored. In addition, if the lowest history value is below the floor value, the floor value is ignored. Floor Value — Minimum forecast value. Ceiling Value — Maximum forecast value. |
Comments
0 comments
Please sign in to leave a comment.