The DRP report is its own report and provides information needed to complete the Distribution Resource Planning process. Data on this report is controlled by the Drp Parameters option on the Data Capture screen, as well as, options on the DRP Options screen. The Drp Parameters option in the Data capture tab indicates how many of the columns from your source data correspond to a parameter that will affect DRP calculations. DRP tables provide a visual representation of the key values in the planning process.
There are 3 different types of DRP reports: DRP pivot report, DRP standard report without On-fly, On-fly DRP report. The table below details what each DRP report feature means.
| Feature | Description |
| Standard |
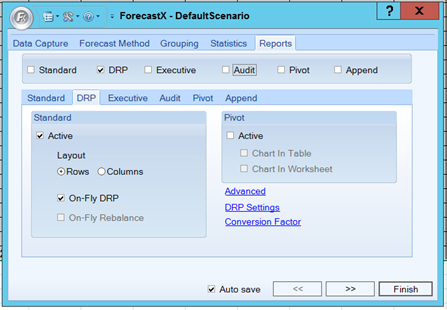
The DRP Standard report is similar to the Standard report but it includes the following Opinion Lines: Rec. Order, Begin Proj. Inv., Rec. Order Arrival, End Proj. Inv., Min. Line, Max. Line, Periods Cov. and Unsupported Fcst. The workbook in which the Standard DRP reports is generated in is protected. The only editable opinion lines will be the Adjust opinion lines. Enable the Active checkbox if you want to generate a Standard DRP report. When selected, you can configure the Standard DRP report. Layout - Determines whether the report data should be in rows or columns. Select On-Fly DRP - Indicates whether the generated report will have the ability to recalculate DRP without having to regenerate the report. Note: This feature is only available in ForecastX. When this option is disabled the report that is generated is static. This means that in order to make any changes to the report’s outcome, you must go back to the data source and edit the historical data to impact the forecast. On the other hand, when the On-Fly DRP option is selected the report generated by the application is dynamic, this means that after a report has been generated you can edit the forecast for any item and recalculate DRP using the newly input values, all without having to create a new report. To recalculate DRP in a On-Fly DRP report you just input the desired adjustments into the Adjust opinion line, and then click On-Fly DRP located in the ForecastX toolbar. Select On-Fly rebalance - Only available when the Group Forecast option has been enabled in the Group by tab. This specifies if the Standard DRP report can be rebalanced once the forecast has been adjusted. Note: This feature is only available in ForecastX. |
| Pivot | If this report is active, it is created inside a new spreadsheet named in a sheet named DRP Pivot Report. It is similar to the Pivot report, but it includes all of the Opinion Lines included in the DRP Standard report. The Opinion Lines included are: Begin Projected Inv, End Projected Inventory, Lower Limit, Periods Coverage, Recommended Orders, Safety Stock, Stat Forecast, Max Line, Min Line, Unsupported Forecast and Upper Limit Select Active.
Select the Active checkbox to generate a DRP Pivot report. When selected, you can configure the DRP Pivot report in two different ways: 1. Chart in table - A chart using the pivot table will be included above the Pivot table in the same sheet. 2. Chart in worksheet - A chart using the Pivot table is included in a different sheet that the one the DRP Pivot table is in. The DRP Pivot report is always generated into a new workbook in a sheet named DRP Pivot Report; it is very similar to the Standard pivot report but there are some differences. The opinion lines included in this DRP Report are the following: Stat Fast, Upper Limit, Lower Limit, Safety Stock, Beginning Inv., Ending Inv., Rec. Order, Unsupported Fcst, Periods Cov. and Turns. The second difference is that the DRP Pivot report only generates data for forecast periods; no Historical data is included in this report. |
DRP Settings
Once the number of DRP parameters has been loaded in the Data Capture tab, those parameters need to be configured.
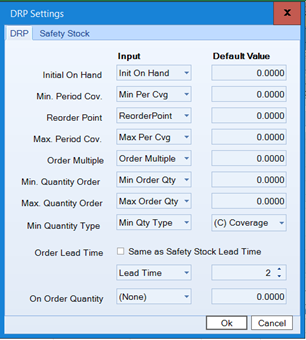
- Click DRP Settings on the Reports tab. The DRP Settings window displays with the DRP tab open.
The following table details what each option means.
| Tab | Description |
| DRP |
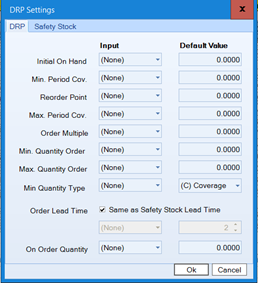
Used to specify the DRP Settings. Each parameter can be configured in two ways: 1. A default Value can be used for each parameter. To use the default value for a specific parameter, select the (None) option in the Input column and enter the desired default number or option in the Default Value column. 2. Using an Input Parameter for each parameter. To configure it is to use the DRP Parameter included in the source data. They have to be mapped to their corresponding field in this configuration. To configure a DRP parameter from the original data you must select the corresponding parameter and fill the correct Label in the Input column. In this case, the default value for that specific parameter is ignored and disabled. The dropdown list available for each of the parameters will only display parameters identified in the DRP Parameters box in the Data Capture tab. Note: If the list of available parameters does not include parameters that do exist in your data, verify the DRP Parameters option in the Data capture window is correct. See Data Capture Tab for additional information. The Opinion Lines below are used in the DRP calculations. They are the only Opinion Lines that can be configured using data included in your Excel workbook. The DRP report can show opinion lines similar to DME: - Initial On Hand - The Initial On hand is the current inventory value for each Record. - Min. Period Cov. - This value represents the number of periods of future demand that should be available at the end of each period. - Reorder Point - This is the minimum inventory value that triggers a replenishment order. Note: This option is disabled and the Default set to Yes when your Safety Stock is used as a Stocking Level or when you use the Slow Moving Output. - Order Multiple - This is the order multiple used when placing a replenishment order. Any orders recommended by the system are multiples of this number.
- Order Lead Time - Number of periods between when an order is placed and received. If the Same as Safety Stock Lead Time checkbox is enabled, the Lead time configuration is taken from whatever configuration has been setup to be in the Safety Stock section; otherwise you need to select one of the configuration types. |
Click on the Safety Stock tab.
The following table details what each option means.
| Tab | Description |
| Safety Stock |
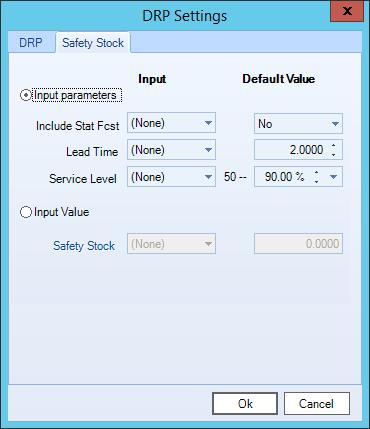
This section is used to determine how Safety Stock is calculated. There are three ways to set Safety Stock: - Input parameters - Select this option if the Safety Stock Lead Time is to be calculated by ForecastX. - Include Stat Fcst - This flag indicates that the forecast value plus the Safety Stock value is to be reported. This means your Safety Stock will be a Stocking Level. The only valid options for this parameter are Yes or No, regardless if it used using the default value or a parameter from your table. Note: Using a parameter for this option or: - Lead Time - This option defines the Safety Stock Lead Time. - Service Level - This value is a target of demand met. This target is converted to a multiplier, which in turn affects the safety stock value. The higher your service level target, the more Safety stock must be carried to cover forecast error or unexpected demand. If you did not select the 'Same as Safety Stock Lead Time' option in the DRP section, click on the Input dropdown and select the data field that contains the safety lead time value for each Record. - Input Value - Select this option if the Safety Stock Lead Time is included in the original data or if you want to set a default value for the Safety Stock parameter. |
Conversion Factors
On the DRP Report, you can apply conversion factors to rec orders (cost) and ending inventory.
When you are using the conversion factor, Cost, you must change the recommended orders and ending inventory. This option includes conversion factors for price and cost opinion lines. The feature is available for all reports except for the Append report type.
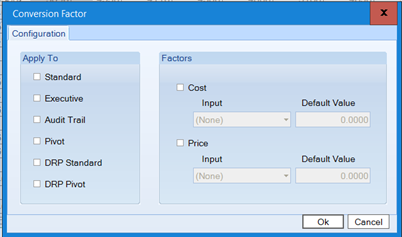
The report will display two columns: Cost.Rec.Orders and Cost.End.Proj.Inv. Remove the Cost column. To get this data, use the Sample ForecastXTrainingSet.xls file and select the Procast DRP sheet.
DRP Example
This section details an example of running a DRP Report to explain the output.
- Click on
 and open the ForecastXTrainingSet.xls file.
Note: The ForecastXSet.xls file is a data example. For your company’s purposes, you will have your own data available. - Click the Procast DRP tab at the bottom of the Excel sheet to select the example spreadsheet.
- Click in a cell containing data and open the ForecastX by clicking on
 .
.
ForecastX displays. - In the Data Capture tab, make sure your Labels are set to 2 and the Parameters set to 5.
- From the Reports tab, enable the DRP checkbox and ensure that it is the one selected.
- Click DRP Settings to configure the DRP parameters.
- Configure each of the Input Parameters using the available labels options in the menus.
- Click OK.
- Click Finish. The Forecast Results window displays.
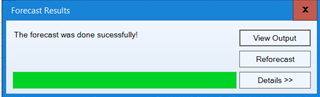
- Click View Output.
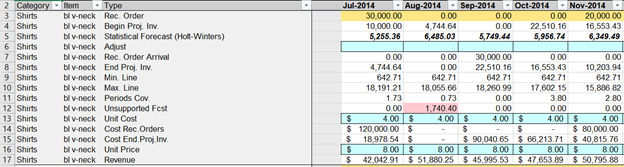
Generating a DRP Report creates several Opinion Lines. The table below details what each Opinion Line means.
| Opinion Line | Description |
| Statistical Forecast | Contains the original Forecast created by ForecastX; in the DRP Report this Opinion Line would represent the current inventory level. |
| Upper Limit | Upper limit which is the highest forecast value based on the calculation of standard deviation. |
| Adjust | Can be edited in order to modify the inventory level. |
| Lower Limit | Lower limit which is the lowest forecast value based on the calculation of Standard Deviation. |
| Safety Stock | Displays the amount of Safety Stock or the Stocking Level depending on how the DRP Settings were configured. |
| Begin Proj. Inv. | Displays the projected beginning inventory at the start of each period. |
| End Proj. Inv. | Displays the projected ending inventory at the end of each period. |
| Rec. Order | Displays the number of orders recommended by ForecastX. |
| Unsupported Fcst. | This opinion line displays any unsupported forecast for a specific period. If a period’s current forecast cannot support the demand with the current inventory level, then the unsupported demand will be displayed here. |
| Periods Cov. | This opinion line displays the number of periods of demand you can cover with the current inventory level. |
| Rec. Order Arrival | |
| Min. Line | |
| Max. Line |
DRP Reports and Group Forecasts
DRP Reports can be generated with or without using Group By Forecast. The table below details how the Opinion Lines in the aggregate levels behave when a DRP Report is generated and the Group Forecast is selected.
| Opinion Line | Description |
| Initial On Hand | |
|
Min. Period Coverage |
Note: When rounding numbers, anything from .6 and above is rounded to the next integer. For example, 2.3 is rounded to 2, and 2.6 is rounded to 3. |
|
Begin Proj. Inv |
|
| Rec. Order | |
| Rec. Order Arrival | |
| End Proj. Inv. | |
| Min. Line | |
| Max. Line | |
| Periods Cov. | |
| Unsupported Fcst. |
Comments
0 comments
Please sign in to leave a comment.