To ensure that the ForecastX™ has been installed successfully, you can access ForecastX by going to Start > All Programs > Microsoft Office > Microsoft Office Excel.
If you do not see the ForecastX on the toolbar, you may have to enable the ForecastX in Excel. Also, if ForecastX is displaying in Excel but none of the buttons work, and nothing happens when the toolbar buttons are clicked, you need to enable the COM add-in.
- If you are using Microsoft Excel 2003 or previous versions, click Tools > Add-Ins from the Excel toolbar. Go to the Add In Window in step 8.
Note: If you are using Microsoft Excel 2007, go to step 2. - If you are using Microsoft Excel 2007, click
 on the top left corner and select Excel. The Excel Options window displays.
- Select Add-ins from the left-hand pane.
- In the menu next to the Manage option, select Excel Add-ins and click Go.
- Ensure ForecastX is listed under Active Application Add-ins.
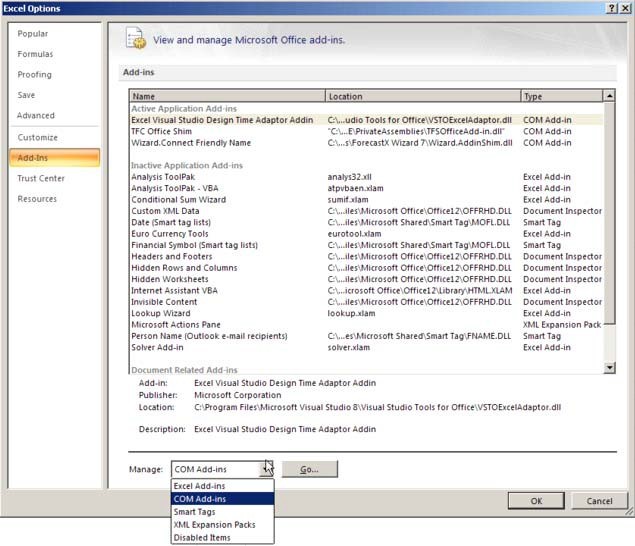
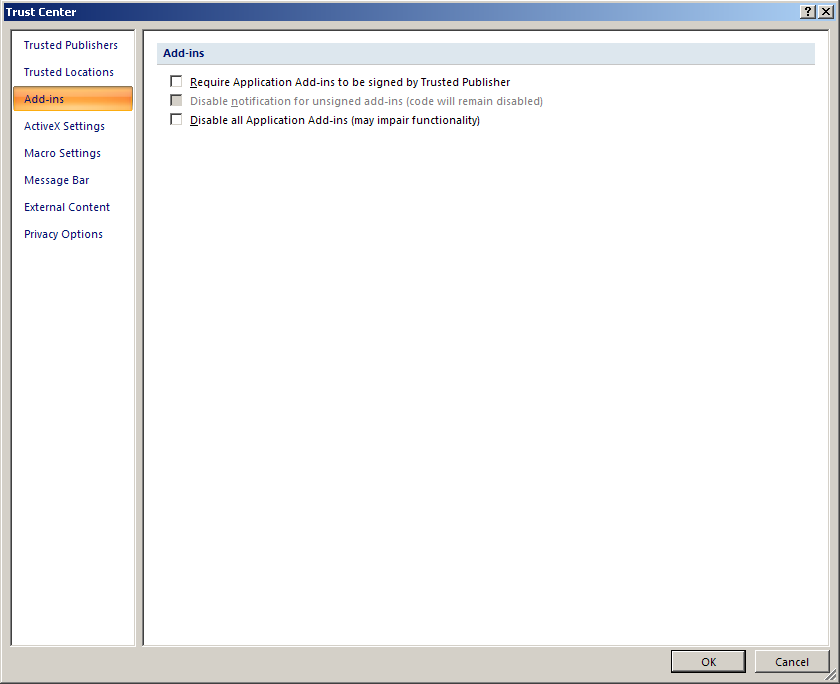
Note: If not, select Com Add-Ins from the Manage menu. Thereafter, select Wizard.Connect Friendly Name from the list, enable the checkbox next to it, and click OK. - Click Trust Center in the left pane and click Trust Center Settings.
Notes:
- Make sure the following checkboxes are disabled: Require Application Add-ins to be signed by Trusted Publisher and Disable all Application Add-ins.
- For previous versions of Excel: Go to Tools > Macro > Security. In the Trusted Publishers tab, make sure the Trust all installed add- ins and templates option is enabled. - Go back to the Excel Options Window, select Add-ins from the pane in the left, select Excel Add-ins from the menu next to Manage text, and click Go. For previous versions of Excel, go to Tools > Add-Ins.
- The Add-Ins window displays.
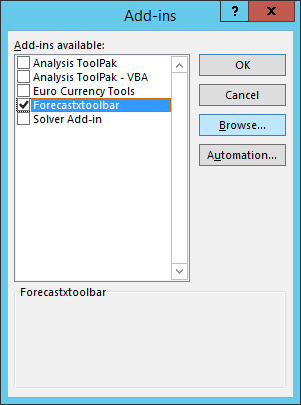
- Select ForecastXToolbar from the list.
- If the ForecastXToolbar Add-In is unavailable in the list, click Browse.
- In the File Selection window, go to the location where you installed ForecastX.
- Select the xls file and then click OK.
- Click OK on the Add-Ins window. The ForecastX toolbar appears in Microsoft Excel.
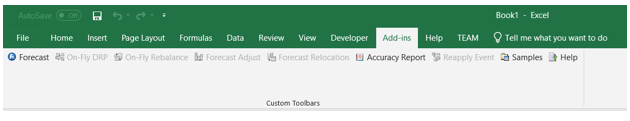
The following table details what each feature means.
ForecastX Toolbar Description Forecast Main button in the toolbar. This button is always enabled, and it is used to run the ForecastX. On-Fly DRP Used to recalculate DRP based on changes made to the forecast. This option can be used to perform the “What if” inventory analysis within the Adjusted Forecast and Safety Stock features.
Note: This feature is only available in ForecastX.
On-Fly Rebalance
Used to rebalance the hierarchy of a group forecast after the report has been generated without the need to create a new report. On-Fly Rebalance is only enabled if the currently selected workbook contains a report that supports On the fly rebalancing. For additional information see the On-Fly Rebalance section in the Group By Tab.
Note: This feature is only available in ForecastX.
Forecast Adjust Used to make adjustments to the forecasted values after they have been generated. This feature is similar to the Data Adjust feature inside the Forecast Method tab.
Note: This feature is only available in ForecastX.
Forecast Relocation Used to copy a report's Forecast to another location. Allows forecast relocation of converted lines without a unit forecast. Available for Standard or Standard DRP reports only.
Note: This feature is only available in ForecastX.
Accuracy Report Used to save historical values to compare with the forecast line in the next periods. You can compare the current period with historical periods using lags report. You can save a maximum of 4 periods.
Reapply Event Used to reapply events when using the Event model forecast method without having to go to the data source and regenerate the report. Enables you to modify the event flags in future periods and recalculate the forecast based in those new events, it is used as a "What If" analysis tool to see the impact of different events in the future.
The Reapply Event feature is only available when the selected workbook contains a Standard report that uses the Event model forecast method and the Allow Reapply option is enabled in the Event model parameters.
Note: This feature is only available in ForecastX.
Samples Open the Samples folder located in the directory where the ForecastX is installed. It contains many example data sets to assist you with understanding the features included in the ForecastX. This can be used in conjunction with the ForecastX Tutorial. Help Opens the ForecastX User Guide. - Click Forecast X to open ForecastX. ForecastX appears.
Forecast Adjust
You can access the Forecast Adjust feature from the ForecastX toolbar. The feature can be used with a Standard Report and any Forecasting method. The Forecast Adjust button is available for Standard and DRP Standard reports only. This option will make your report interactive by allowing you to specify a series and a date range and apply different types of adjustment to the forecast.
Note: This feature is only available in ForecastX.
To use Forecast Adjust:
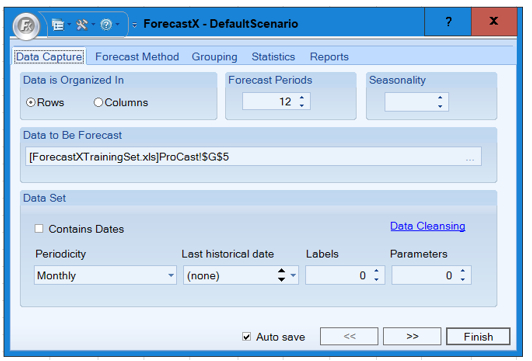
- After creating a Standard report, click
 . The Forecast Adjust window displays.
The following table details what each feature means:
Feature Description Data Series to Adjust
Select which data series you would like to adjust in the currently selected report.
Start Date / End Date
Select the start and end dates. The start and end date display the first and last period of the forecast for the selected report. Any adjustments affect the forecast periods within these two dates only.
Adjust by Value Used to adjust the Forecast by a specific value. To modify the forecast by a specific amount, enter any value into the corresponding box and click + next to it. For example, if a series has a value of 1000 for a specific month then adjusting it by a value of 50 changes the forecast for that month to 1050, the change is reflected in the Actual Opinion Line. Adjust by Percent
Used to adjust the forecast based on a percentage of each observation. To modify the forecast by a percentage amount, enter any value into the corresponding box and click + next to it. For example, if a series has a value of 1000 for a specific month then adjusting it by 50% changes the forecast for that month to 1500, the change is reflected in the Actual Opinion Line.
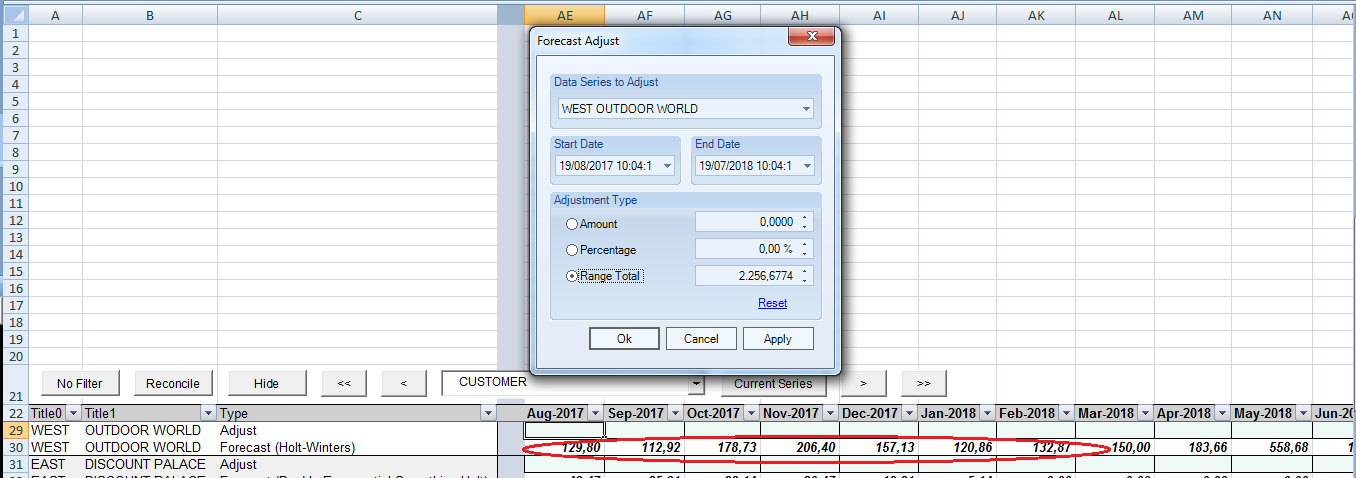
Range Total Used to span a total across the selected date range. For example, if three periods are selected using the start and end date and they total 15000 then when the box is changed to 11000 the new total for those three periods will be 11000 and it is reassigned to each period based on how much each period originally contributed to the original total of 15000, the change is reflected in the Actual Opinion Line. Opinion Lines Select which opinion line you would like to adjust in the currently selected report. - Click Apply when finished. Click Reset to reset the values to the default.
Range Total
After the report is generated, you have an option called Forecast Adjust in the Add Ins section. This option shows a Forecast Adjust window with a range total. Calculate the range total value with the option line forecast. If it does not exist or if it is blank, use the Adjust Value.
Remember that this Range Total only considers the adjust option line when at least one is edited.
Forecast Relocation
Used to copy a report's Forecast to another location. Available for Standard or Standard DRP reports only.
Note: This feature is only available in ForecastX.
To use the Forecast Relocation:
- After creating a Standard report, click
 . The Forecast Relocation window appears. Forecast Relocation does not include the name of the forecast method in its output.
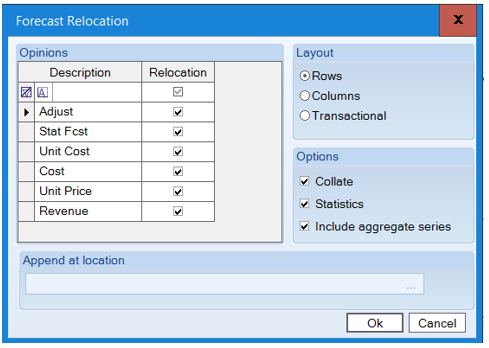
The following table details what each feature means.
Feature Description Opinions This list displays all the available Opinion Lines. The Opinion Lines vary depending on which ones were selected for the report. Layout Used to select the layout of the resulting Forecast Relocation. You can select to relocate the forecast in rows, columns or Transactional.
Options Holds the option on how the relocated forecast should be organized.
Collate - This option specifies whether to organize the data by Opinion Line or by series. When this option is enabled, the data is sorted by Opinion Line, and when the option is disabled the data is sorted by series name.
Statistics – Allow forecast relocation of error measures.
Include aggregate series - the user will include aggregate level when the grouping is enabled.
Append at location
Location where the forecast is copied to; it can be in another spreadsheet in the same workbook or in a completely different workbook. If a location is not specified, a new workbook is created with the forecast in it.
- Click Apply when finished.
Comments
0 comments
Please sign in to leave a comment.