Procast™ is ForecastX's™ one-step forecast with expert selection. Procast chooses from complex forecasting techniques, including most time series forecasting methods, new product growth curves, and Regression models to produce fast, accurate, and easy to read results.
You can run Procast on a single data series or create an unlimited batch forecast. Once Procast has been activated, ForecastX determines the best forecasting technique for each data series in your particular data set.
To open the Procast forecasting technique:
- Click
 and open the ForecastXTrainingSet.xls file.
 - Click the Procast tab at the bottom of the Excel sheet to select the example spreadsheet.
- Click in a cell containing data and open the ForecastX by clicking
 . ForecastX appears.
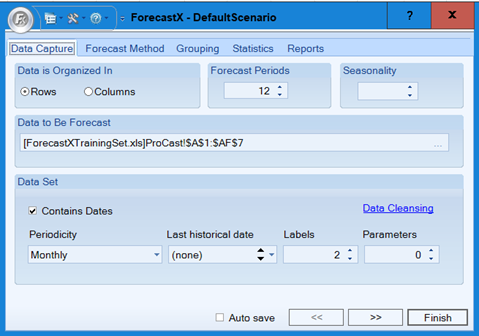
- Click the Forecast Method tab. By default, the Procast Forecasting technique appears.
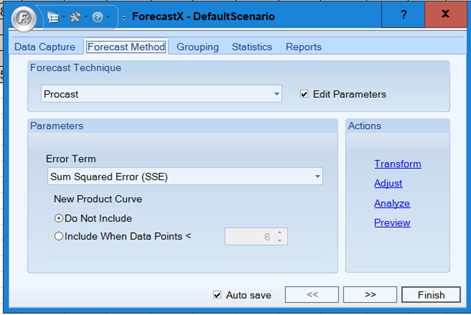
- Enable the Edit Parameters check box to activate Procast’s parameters.
The following table details what each parameter means.
Parameter Description Error Term The measurement Procast uses to determine which forecasting method is optimal. The best method produces the smallest value of the designated statistics. New Product Curve There are two options for the New Product Curve parameter:
Do Not Include — Select this option to remove the New Product Curve as one of the forecast methods options.
Include when Data Points < — Select this to include New Product Curve as a forecasting method, if the number of observations in the series is less than the number you specify.
- Click Finish. The Forecast Results window appears. The Forecast Result window enables you to view certain information about the generated report such as the number of items that were processed for the report.
- To accept the Forecast, click View Output.
- To rerun the Forecast, return to the original workbook and click Reforecast. The Data Capture tab displays to allow you to select other forecasting techniques.

A Standard Report is generated on a separate spreadsheet. The new report lists the forecasting method used for each data series. The fitted and forecasted values are listed below the actual values for each series.
Scroll to the right of the spreadsheet to see the forecasted values listed in bold. To the right of the forecasted values, ForecastX produces four accuracy statistics that help you determine the accuracy of the forecast.
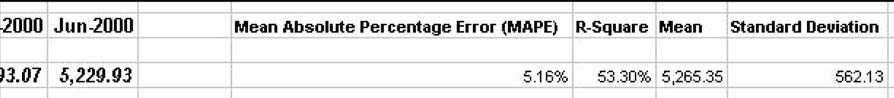
The following table details what each statistic means:
| Statistic | Description |
| WMAPE |
The average percent difference between the forecast model and the actual history. The weighting is an adjustment based on volume, so periods with higher demand have a greater impact on the calculation than periods with low demand. |
| R-Square | Determines how well the fitted values compare to the actual values. |
| Mean | The average value of each series. |
|
Standard Deviation |
The measure of how widely the values in a group of data spread. It is defined as the square root of the variance. |
Data Cleansing
As an advanced option, you can use Data Cleansing to improve the accuracy of a Forecast. For additional information, see Data Capture Tab.
Group Forecasting
As an advanced option, you can group forecast through the Group By tab. The Group By tab provides access to group forecasting’s features and options. For additional information, see Grouping Tab.
Event Modeling
If there are special occasions or promotional events, ForecastX takes them into account while developing your Forecast. When you are able to identify major promotions that impact sales, you can mark these occasions and ForecastX can enhance the forecasts based on the promotional plan.
Note: The following steps provide instructions for running a forecast without Event and Promotional models, as well as steps with Event and Promotional models. Thereafter, you can compare the results.
- Click
 and open the ForecastXTrainingSet.xls file.
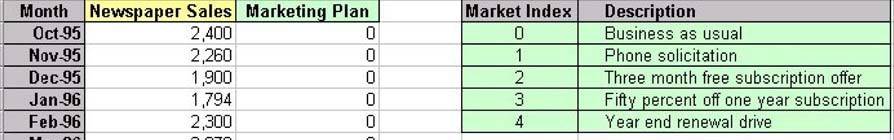
Note: The ForecastXTrainingSet.xls file is a data example to demonstrate how the Procast method is used. For your company’s purposes, you will have your own data available. - Click the Event Modeling tab at the bottom of the Excel sheet to select the example spreadsheet.
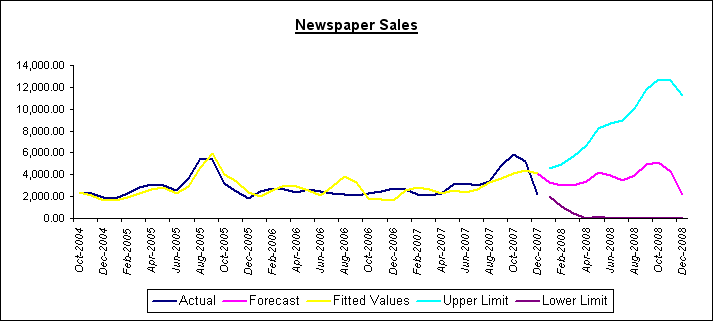
The Event Modeling sheet contains a column of Newspaper Sales and the Marketing Plan associated with those sales.
- Highlight the Months and Newspaper Sales data found in rows 1 to 40 and columns A to B and open the ForecastX.
- On the Data Capture tab, ensure that Columns is selected in the Data Is Organized In area.
- On the Forecast Method tab, make sure Procast is the selected Forecast Technique.
- On the Reports tab, disable the Standard checkbox and enable the Audit checkbox.
- Click Finish. ForecastX displays an Audit report and a graph of the results. You can see the forecast results and the error measurements without Event Modeling performed.
Event and Promotional Modeling Forecasting
To forecast using Event and Promotional Modeling:
- Click
 and open the ForecastXTrainingSet.xls file.
Note: The ForecastXTrainingSet.xls file is a data example to demonstrate how the Procast method is used. For your company’s purposes, you will have your own data available. - Click the Event Modeling tab at the bottom of the Excel sheet to select the example spreadsheet.
- Highlight the Months and Newspaper Sales data found in rows 1 to 40 and columns A to B, and open ForecastX. ForecastX appears.
- On the Forecast Method tab, select the Event Model forecasting technique and enable the Edit parameters checkbox to activate the Event Model’s parameters.
- Define the event flag data range by highlighting all of column C.
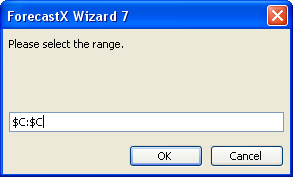
- Click OK. The Forecast Method window appears.
- On the Reports tab, disable the Standard checkbox and enable the Audit checkbox \.
- Click Finish.
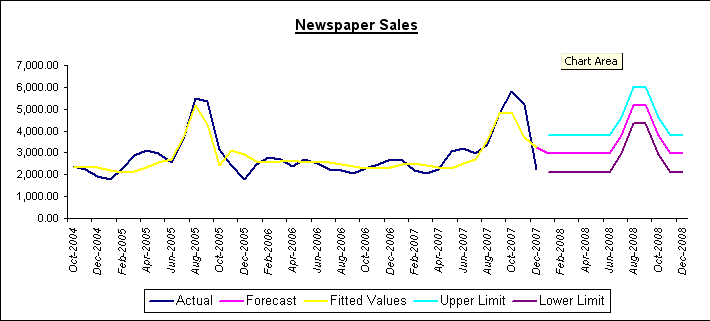
On the Audit Report, you see the effect of the events on Newspaper Sales and how your error measurements improve. The Audit Trail report provides you with additional statistical data, including the event lift factors.
This report includes an Event Index, which represents each event’s lift factor over the base forecast.
By comparing the graphs from Procast and Event Model, you can understand the effect of the events on Newspaper Sales and see how the error measurements improve.
Note: You can click Advanced in Event Modeling to choose forecasting techniques and perform a Monte Carlo analysis for best case/worst case analysis on each event. See Event Model for additional information.
Comments
0 comments
Please sign in to leave a comment.