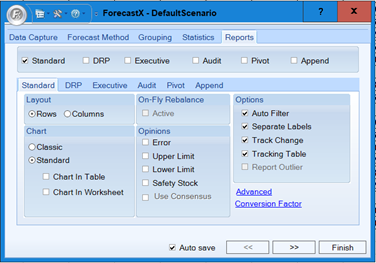
The Standard Report is built for speed and handling large volumes of data. It produces a side-by-side report listing the actual values compared to the forecasted values. It also includes selected statistics and a few common statistics: Weight Mean Absolute Percentage Error (WMAPE), R-Squared Value, and Standard Deviation.
The table below details what each Standard report feature means.
| Feature | Description |
| Layout |
This feature is used to determine what the layout of the generated report will be: Rows - Data in the report is arranged in rows. Columns - Data in the report is arranged in columns. |
| Chart |
There are two chart options: 1. Classic - Selecting this option generates a regular Standard report that includes the forecast in the first sheet and it includes a chart for each of the series in each subsequent sheet. 2. Standard - Selecting only the Standard option generates a report that includes a sheet with the forecast for the selected data and no charts. If you wish to include charts in your Standard report there are two options: b. Chart in Worksheet - When this option is selected, each of the series in your data receives its own chart in a new sheet. |
On-Fly Rebalance
On-Fly rebalance is used to specify if the Standard report should support On-Fly rebalance. When this option is selected the report that is generated supports this feature and the On-Fly Rebalance button is enabled for that report. This feature makes your report interactive by allowing you to redistribute changes in the forecast to its children or parent series For more information see the On-Fly rebalance section from Group by tab.
On-Fly rebalance is disabled if the Group forecast option is disabled in the Group by tab.
Note: This feature is only available in the Xpert Tool Kit.
| Feature | Description |
| Opinions |
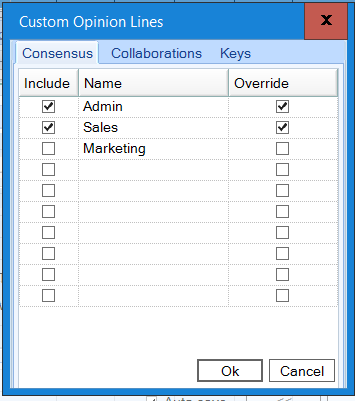
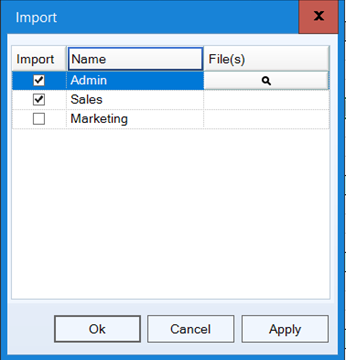
Specifies which Opinion Lines should be included in the Standard report. There are four Opinion Lines available: Error - Select this option to include the Error Opinion Line. For additional information, see the Error or Residual sections in Statistics. Upper Limit - Includes the highest forecast value based on the calculation of standard deviation on reports. Lower Limit - Includes the lowest forecast value based on the calculation of Standard Deviation on reports. Safety Stock - Includes the calculated Safety Stock value on the report. Use Consensus - Lets you use different input sources/Opinion lines that will be used or discarded in order to obtain a Final Forecast opinion line. Note: It is necessary include a new section to Use consensus, the option contains new tabs and definitions. For example:
Click Import.
|
| Options |
Options are used to specify different selections that can be included in the Standard report. There are four types of options that can be used: 1. Auto Filter - Select this option to add the auto filter ability to the standard report. 2. Separate Labels - Select this option to separate labels in multiple cells as in the input data. 3. Track Change - Select this option to add a macro to the Standard report which tracks any change and support the consolidation function. Enabling this option will include a button named Reconcile in the standard report. Note: When this option is selected, the Standard report's worksheet is protected. Only the Adjust opinion line is editable. 4. Tracking Tables - Enables you to make graphical and table changes to the forecast. It also enables you to compress or hide the Historical data, so you can focus on the forecasted values only. This will include a button in the Standard report that can change from the three different states: Normal, Compress and Hide. For additional information, see the Reports Advanced Options section. 5. Report Outlier - Used to specify if outliers should be reported or not. If this option is selected, any outliers replaced by ForecastX’s engine are noted in the report; any cell containing an observation point which was replaced by the Replace Outliers feature includes a comment in it, that comment includes the original value that observation point had before the replacement. For additional information, see the Data Cleansing section in Data Capture Tab. Note: This option is disabled if the Replace Outliers option from the Data Cleansing section is not enabled. |
Standard Report Grouping Example
The example below details a running a Standard Report in order to explain the output.
- Click on
 and open the ForecastXTrainingSet.xls file.
Note: The ForecastXTrainingSet.xls file is a data example. For your company’s purposes, you will have your own data available. - Click the Batch Forecasting tab at the bottom of the Excel sheet to select the example spreadsheet.
- Click in a cell containing data and open ForecastX by clicking on
 . ForecastX displays.
 - On the Data Capture tab, ensure the Labels are set to 2 and the Parameters set to 0.
- From the Grouping tab, enable the Group Forecast checkbox.
- Left-click on the Region label header and drag it to where it says "drag a column header here to group by that column."
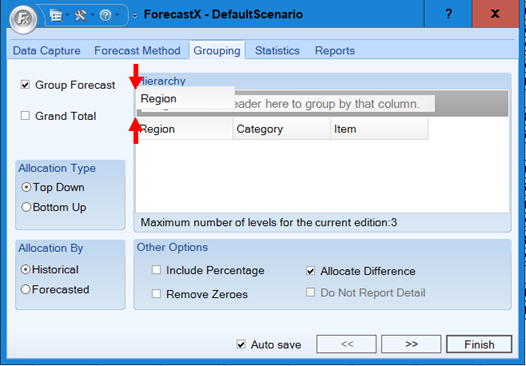
- Repeat the same procedure with the Category label header.
Note: Multi-level grouping is a feature only available in ForecastX.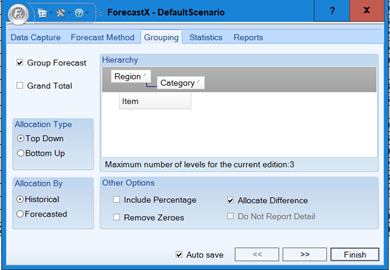
- From the Reports tab, enable the Standard checkbox and ensure it is the only one selected.
- Ensure that the Active checkbox under the On-Fly rebalance is selected.
Note: On-Fly rebalance is a feature only available in ForecastX.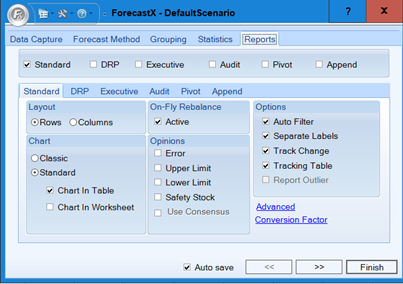
- Click Finish.
- Click View Output.
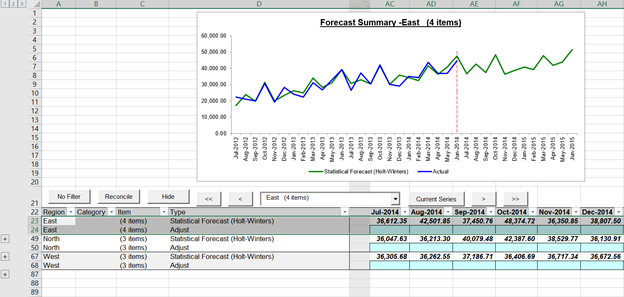
This report shows that there are 3 regions in our data East, North and West and that each of the groups have 4 items, 3 items and 3 items, respectively.
To expand a whole level, use the numbers on the top left of the row numbers. To expand a single item, use the + icon on the left of each item.
Comments
0 comments
Please sign in to leave a comment.