ForecastX™ enables you to select specific Forecasting techniques and parameters. Techniques include time series, promotional, regression, and growth curve models.
To select a Forecasting technique:
- From ForecastX, click the Forecast Method tab. The Forecast Method window appears with the Procast forecast technique shown as the default.
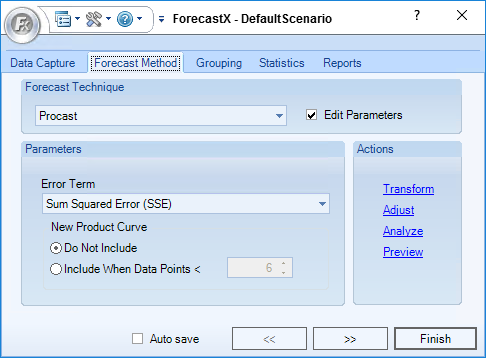
- From the Forecast Technique menu, select one of the techniques available. The features in the Actions section enables you to analyze and manipulate your data with several tools. Each tool is explained in the following sections.
Transform
There are several techniques in ForecastX that test the data to see if a data transformation is necessary. However, ForecastX also enables you to view a Variance chart. Data Transformation enables you to chart the variance to see if the variance of the data is constant. For additional information, please see the Variance section in Analysis Statistics.
- From the Actions area on the Forecast Method tab, click Transform. The Data Transformation window appears.
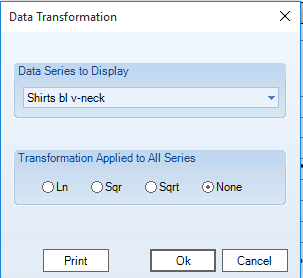
- From the Data Series to Display menu, select a data series you would like to display.
- From the Transformation Applied to All Series section, select a transformation method.
- Click OK when finished.
Adjust
The Adjust feature enables you to view a graph of your actual data and perform adjustments, as well as adjust data by either a percentage or a value.
- From the Actions area on the Forecast Method tab, click Adjust. The Data Adjustment window appears.
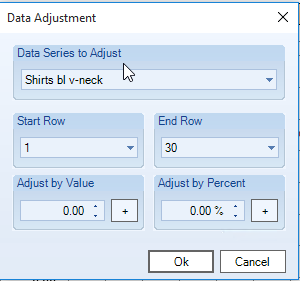
- In the Data Series to Adjust menu, select the data series you would like to adjust.
- In the Start Row and End Row menus, select the range of data that you would like to adjust.
- Determine how you would like to adjust your data by either entering a number in the Adjust by Value or Adjust by Percent fields. To apply an adjustment, click + next to the adjustment type used.
- Click OK to apply the adjustments.
Analyze
The Data Analysis feature enables you to test if a data set is stationary by performing seasonal and non-seasonal differencing. This test is an important test for ARIMA modeling.
- From the Actions area on the Forecast Method tab, click Analyze. The Analyze window appears.
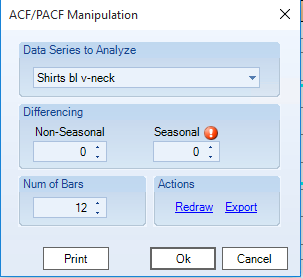
- In the Data Series to Analyze menu, select the data series you would like to adjust. An ACF and PACF graph appears.
- Set the non-seasonal or seasonal differencing. The graph reflects the changes the differencing makes.
- In the Num of Bars textbox, enter the number of bars you would like displayed on the graph.
- Click Redraw to get an updated graph if the Num of Bars parameter has been changed.
- Click Export if you would like to export the graph to a new Excel sheet.
- Click OK when finished.
Note: For more detailed information performing ARIMA analysis, see the Performing ARIMA Analysis in the Box Jenkins section.
Preview
The Preview feature enables you to get a graph preview of your currently selected data.
- From the Actions area on the Forecast Method tab, click Preview. The Preview window appears.
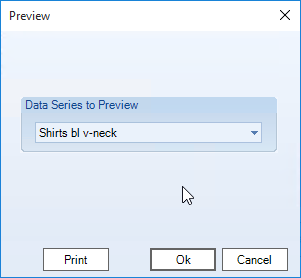
- In the Data Series to Preview menu, select a data series. By default, the Excel sheet that is open is listed in the textbox.
- Click OK.
Comments
0 comments
Please sign in to leave a comment.