The Advanced link is used to access the Reports Advanced features that provide you with more collaborative ability when generating a report.
Standard
To access the Standard Reports Advanced Options:
- From the Reports tab, click Advanced. The Reports Advanced Options window displays with the Standard tab displayed as a default.
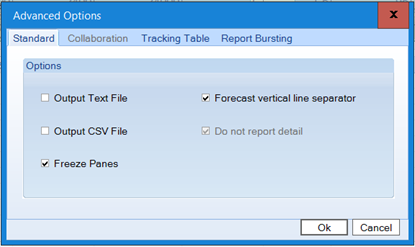
- Select either Output Text File or Output CSV File or both.
Option Description Output Text File Enable this option to save the Standard report to a text file (tab delimited).
Note: This text report is created under your “My Documents\My Forecasts” folder for the user currently logged into the machine.Output CSV File Enable this option to save the Standard report to a CSV (Comma delimited).
Note: This text report is created under your “My Documents\My Forecasts” folder for the user currently logged into the machine.Freeze Panes Used to lock specific rows and columns in place. Forecast vertical line separator Enable this option to display a vertical separator between history and forecast data. Do not report detail Enable this option to hide the history data in the data part. This is used with the grouping option. If you do not need it, see the detail sheet only by group. - Click OK when finished.
Collaboration
Collaboration enables you to customize the Tracking Table in the Executive Report. You can add new Opinion Lines to your report that will be included in the graphs. Collaboration also adds totals in the reports generated based on the forecast and the new customized Opinion Lines.
To access the Collaboration Advanced Options:
- From the Executive tab, enable the Collaboration checkbox.
Note: The Collaboration tab is enabled only when this checkbox is enabled. - From the Reports tab, click Advanced.
- Click the Collaboration tab.
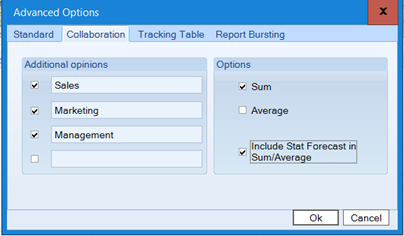
The following table details what each feature means.
Feature Description Additional opinions Used to define up to four additional Opinion Lines to be included in the Executive Report. To include an extra Opinion Line, enable the checkbox then select a name for that Opinion Line. Options Provides additional options for the Tracking Table in the Executive Report.
- Sum - Enable this checkbox to include an Opinion Line that will be the Sum of all the extra Opinion Lines added in the Additional Opinions section.
- Average - Enable this checkbox to include an Opinion Line that will calculate an average of all the extra Opinion Lines added in the Additional Opinions section.
- Include Stat Forecast in Sum/Average - Sum and Average Opinion Lines are included the Forecast Opinion Line before being calculated. - Click OK.
Tracking Table
The Tracking Table enables you to make graphical and table changes to the Forecast. You can also compress or hide the Historical data in order to focus on the Forecast values only.
To access the Tracking Table Reports Advanced Options:
- Select the Collaboration checkbox on the Executive tab to activate the Tracking Table feature in the Executive Report.
Note: Considering the Audit Trail includes the Executive Report, the Audit Trail inherits this feature if the Executive Report has it, as well. The Tracking Table option has been renamed ForecastX to Collaboration. - From the Reports tab, click Advanced.
- Click the Tracking Table tab.
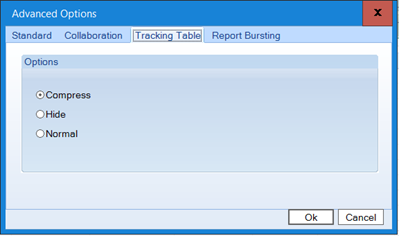
- Select one of the following options. These settings are applied to the Tracking table that can be generated for the reports. The option selected defines the default view for the tracking table.
Option Description Compress Enable this option to have the Historical data compressed in the report. Hide Enable this option to have the Historical date hidden in the report. Normal Enable this option to have the Historical data displayed in the report. - Click OK when finished.
Report Bursting
Report Bursting groups reports by assigned category type so that each category is reported in a separate workbook. This is beneficial if you would like to focus on each category separately. You can use multiple labels to group your data.
To access the Report Bursting Reports Advanced Options:
- From the Reports tab, click Advanced.
- Click the Report Bursting tab. The Report Bursting Reports Advanced Options window displays.
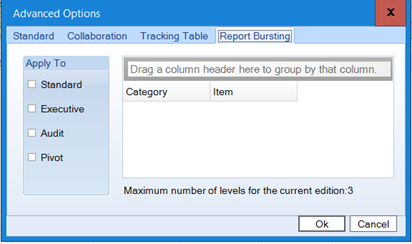
- Use the pane in the right to select the desired fields to group your data by.
Note: When the Group forecast option is the Group by tab that is enabled, you cannot define which labels to use to group the report. The same defined grouping as in the Group by tab is used.
Note: The number of available columns to group data is defined by ForecastX, for more information see Software Editions. - Use the Apply To section to enable the Report Bursting for any report.
- Click OK.
Comments
0 comments
Please sign in to leave a comment.