Through the DRP Report, the Wizard can calculate inventory consumption, recommended orders, and safety stocks. This allows you to take your highly accurate forecast and translate it into practical supply chain policies.
Open the Excel file ForecastX_Samples.xls and click the Procast DRP worksheet. This worksheet contains the same apparel data as the previous Procast tabs, but also includes 10 parameters that describe your current inventory situation. Hover over each parameter’s header to read a brief description.

- Highlight the first cell of data and open ForecastX.
- On the Data Capture tab, set the Parameters option to 10.
- On the Reports tab, disable Standard and enable DRP.
- Click DRP Settings at the bottom right.
- Assign the fields contained in the data file to those on the DRP Settings screen.
a. Assign the Init On Hand field to the Initial On Hand option.
b. Assign the Min Per Cvg field to the Min. Period Cov. option.
c. Assign the ReorderPoint field to the Reorder Point option.
d. Assign the Max Per Cvg field to the Max. Period Cov. option.
e. Assign the Order Multiple field to the Order Multiple option.
f. Assign the Min Order Qty field to the Min. Quantity Order option.
g. Assign the Max Order Qty field to the Max. Quantity Order option.
h. Assign the Min Qty Type field to the Min Quantity Type option.
i. Click the Safety Stock tab at the top of the DRP Settings screen.
j. Assign the Lead Time field to the Lead Time option.
k. Assign the Service Level field to the Service Level option. - Click OK to save the report parameters and return to the Reports screen.
- Click Finish. When the forecast is complete, click View Output.
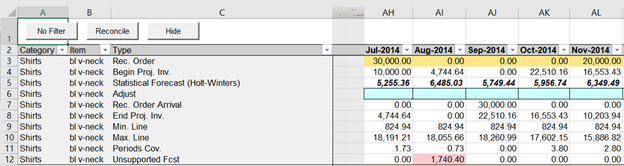
This report provides a wealth of information about how your inventory levels will respond to demand based on your forecast. At the top of the report is the recommended order quantity for each period. The next few lines show how inventory will be consumed by the forecast: Begin Proj. Inv – (Forecast OR Adjust) + Rec. Order Arrival = End Proj. Inv.
The Min. and Max. Line rows represent your inventory targets based on the replenishment rules entered – your inventory levels will balance between these as closely as your order multiples and min/max order quantities allow. The Periods Cov. line indicates how many periods of demand can be covered by the month’s beginning inventory. Finally, the Unsupported Fcst line indicates where inventory is insufficient to cover demand, and by how much – in the example above, the second month will have a negative inventory balance of 1,740 units.
Since we selected the On-Fly DRP option our report is interactive. You can make changes to your forecast and then recalculate DRP without generating a new report. For example, go to the first period (cell AH6) and set the Adjust line to 1000 units; now click On- Fly DRP in the Wizard toolbar and click OK.
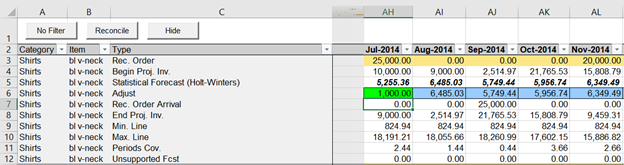
As you can since we reduced our demand to 1000 units, there is no longer unsupported forecast for the second month.
Comments
0 comments
Please sign in to leave a comment.