ForecastX can take special events and promotions into account while you are developing your forecast.
When you are able to identify major promotions that impact sales, you enhance the accuracy of the forecast. With ForecastX, you can tag past events and tag when the event will occur in the future. The ForecastX will take the past events, measure how the events affected history and apply a lift factor to the forecast for each future event.
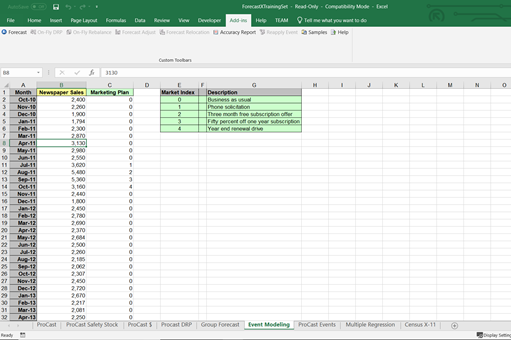
Using the Excel file ForecastXTrainingSet.xls, click the Event Modeling worksheet. Here you will see columns, Newspaper Sales and the Marketing Plan, and the data associated with those sales.
- Highlight the Months and Newspaper Sales data (rows 1-40, columns A & B) and open ForecastX.
With the Data Capture screen open, notice that ForecastX has recognized that the data is arranged in columns, not rows. - When the report is done, click View Output and review the forecast.
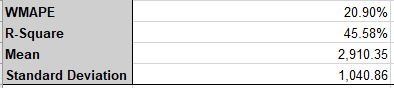
ForecastX creates a standard report and a graph of the results. Please note that the forecasted results and error measurements reflect a forecast without any type of event modeling.
Using the same workbook, ForecastXTrainingSet.xls, and the Event Modeling worksheet, you can now see what happens when Event Modeling is used.
- Highlight Months and Newspaper Sales (rows 1-40, columns A & B) and open ForecastX.
- With the Data Capture screen open, click the Forecast Method tab.
- Under Forecasting Techniques, use the menu to select Event Model.
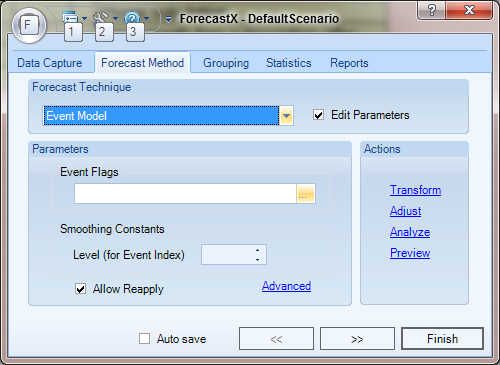
- Under Event Flags, click on the ellipsis (...) button at the end of the text. The Range Selection screen appears.
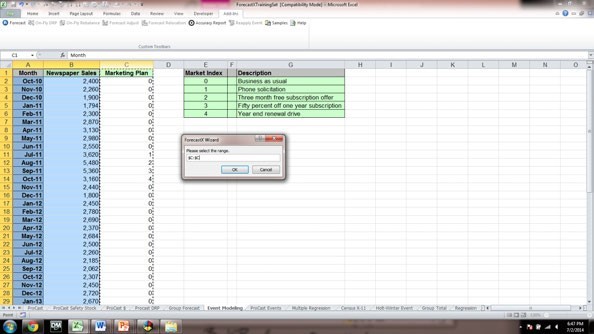
- Define the event flag data ranges by highlighting column C Marketing Plan and then click OK. The Forecast Method screen appears.
- Click the Reports Check Audit and then click Finish.
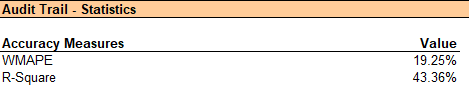
Now we can understand the effect of the events on Newspaper Sales and see how our error measurements have improved. The Audit Trail report provides you with additional statistical data, including an Event Indices section. These indices tell you how effective each promotion was at increasing sales – numbers above 1 indicate a positive lift (e.g. an index of 1.28 indicates a 28% lift over the expected sales without the promotion), and numbers below 1 could indicate a negative lift.
Event Modeling does not require that you run on promotions only; it can run on any type of unusual event, whether positive or negative, and can be very effective at cleaning these unusual events from history.
Comments
0 comments
Please sign in to leave a comment.