The Audit Trail Report generates a detailed analysis of the Forecast. It displays all the information provided in the Executive Report, as well as, the statistics that were chosen and optional tables. The Audit Report is optimal for justifying Forecasts with statistics. Executive and Audit Reports only show at the Aggregate Levels.
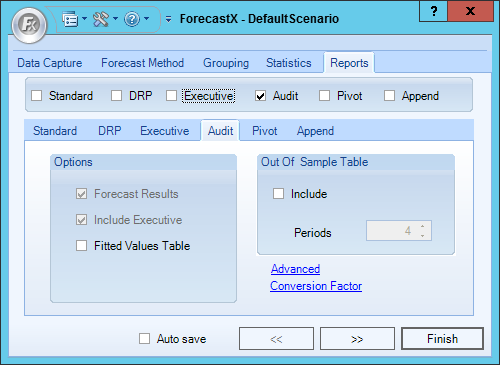
The table below details what each Audit Trail Report Option means.
| Option | Description |
| Forecast Results | Includes the forecast table in the Audit report, it is checked by default and it is always disabled to the user. |
|
Include Executive |
Include an Executive report within an Audit report. It is checked by default and it is always disabled to the user. |
|
Fitted Values Table |
Includes a table of the Forecast fitted values. |
|
Out of Sample Table |
If this checkbox is enabled the report will include a table of holdback statistics. You must specify the number of periods to hold back from your analysis. Note: The Out of sample option will be disabled when Grouping is enabled or when one of the following forecast methods is selected: Census X11, Decomposition, Erlang B, Erlang C, Event Model, Multiple Regression, New Product Forecasting, Poisson, Polynomial Regression or Stepwise. Instead of using its own algorithm, this version uses the standard algorithm. |
Comments
0 comments
Please sign in to leave a comment.